

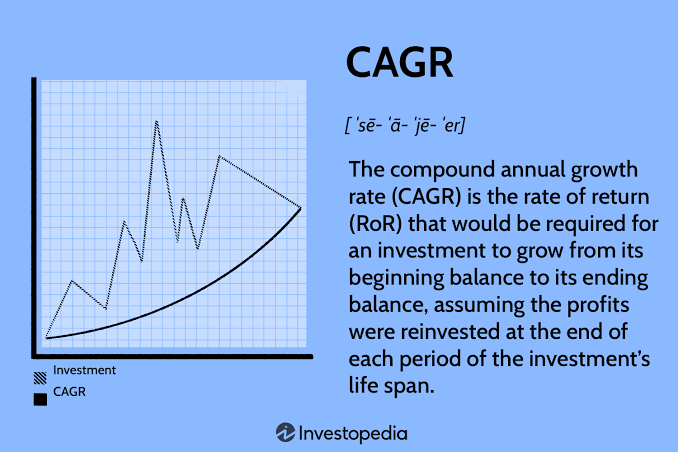
If you have ever compared two investments and wondered, “Which one actually grew faster each year?”, CAGR is one of the simplest financial metrics to understand.
CAGR stands for Compound Annual Growth Rate. It represents the annualized growth rate of an investment or business metric over a specific period, assuming the growth had occurred at a constant compounded rate.
In simple terms, CAGR converts growth over several years into a single annualized percentage.
For example, suppose an investment grows from ₹1,00,000 to ₹2,00,000 in five years. The total gain is 100%, but saying the investment gained 100% every year would be incorrect.
CAGR gives you a more useful annualized figure that accounts for compounding.
The standard CAGR formula is:
CAGR = (Ending Value ÷ Beginning Value)^(1 ÷ Number of Years) − 1
This is a geometric annualized growth measure and is widely used in investment analysis, business analysis and financial planning.
AI Answer Box: What Is CAGR?
Quick Answer
CAGR, or Compound Annual Growth Rate, is the annualized rate at which an investment or business metric would have grown if it had increased at a constant compounded rate over a specific period.
It is calculated using the beginning value, ending value and investment period.
CAGR is particularly useful when comparing investments or business growth across different time periods.
However, CAGR is a smoothed historical growth measure. It does not show the actual year-by-year ups and downs of an investment and should not be interpreted as a guaranteed future return.
What Is CAGR?
CAGR means Compound Annual Growth Rate.
It answers a straightforward question:
“At what constant annual compounded rate would the starting amount have grown to the ending amount over this period?”
CAGR is useful because investment returns rarely occur in a perfectly consistent pattern.
An investment might generate:
- 8% in one year
- 20% in another
- -5% in another
- 15% in another
Instead of analyzing every annual movement, CAGR provides one annualized number representing the overall growth between the starting and ending values.
The U.S. Securities and Exchange Commission's Investor.gov explains compound growth as earning returns on both the original investment and accumulated returns.
CAGR Full Form
CAGR full form: Compound Annual Growth Rate
Each part of the term is important:
- Compound — growth builds on previous growth.
- Annual — the result is expressed on a yearly basis.
- Growth — it measures change between a beginning and ending value.
- Rate — the result is expressed as a percentage.
CAGR Formula
The standard formula is:
CAGR = (Ending Value / Beginning Value)^(1 / Number of Years) − 1
Where:
| Variable | Meaning |
|---|---|
| Beginning Value | Initial value of the investment |
| Ending Value | Final value of the investment |
| Number of Years | Investment or measurement period |
| CAGR | Compound annual growth rate |
The same relationship can be rearranged to estimate an ending value when the starting value, CAGR and period are known.
How to Calculate CAGR Step by Step
Let's use a simple example.
Suppose:
- Initial investment = ₹1,00,000
- Final value = ₹2,00,000
- Investment period = 5 years
The formula becomes:
CAGR = (₹2,00,000 ÷ ₹1,00,000)^(1/5) − 1
Therefore:
CAGR ≈ 14.87% per year
This means the investment would need to grow at approximately 14.87% per year on a compounded basis to turn ₹1,00,000 into ₹2,00,000 over five years.
It does not mean the investment actually returned exactly 14.87% in every individual year.
That distinction is extremely important.
CAGR Example: ₹1 Lakh Investment
Consider this example:
| Particular | Value |
|---|---|
| Initial investment | ₹1,00,000 |
| Final value | ₹2,00,000 |
| Period | 5 years |
| CAGR | Approximately 14.87% |
The actual investment could have experienced very different returns from year to year.
CAGR simply converts the complete beginning-to-end growth into an annualized compounded rate.
CAGR Example With a Business
CAGR is not limited to investments.
Suppose a company's revenue increases from:
₹50 crore → ₹100 crore
over four years.
The CAGR would be:
CAGR = (100 ÷ 50)^(1/4) − 1
The resulting CAGR is approximately 18.92%.
This allows analysts to describe the company's revenue growth using a single annualized figure.
CAGR can therefore be applied to metrics such as:
- revenue
- profit
- assets under management
- customer base
- sales
- market size
- investment value
- portfolio value
Why Is CAGR Important for Investors?
CAGR helps investors compare growth over different periods.
Suppose two investments have the following historical results:
| Investment | Starting Value | Ending Value | Period | CAGR |
|---|---|---|---|---|
| Investment A | ₹1 lakh | ₹1.50 lakh | 5 years | 8.45% |
| Investment B | ₹1 lakh | ₹2 lakh | 5 years | 14.87% |
Looking only at the ending value tells you that Investment B doubled while Investment A did not.
CAGR adds another layer by expressing the growth as an annualized rate.
However, CAGR alone should not be used to select an investment.
Investors should also examine:
- risk
- volatility
- fees
- taxes
- liquidity
- investment objective
- drawdowns
- portfolio composition
- investment horizon
What Does CAGR Tell You?
CAGR tells you the smoothed annualized growth rate between two values.
It is particularly useful for:
Comparing Historical Growth
You can compare the historical growth of different investments over the same period.
Understanding Long-Term Growth
CAGR can make multi-year growth easier to understand.
Comparing Business Performance
Companies can use CAGR to describe revenue, earnings or customer growth.
Measuring Portfolio Growth
Investors can use CAGR to understand how an investment grew between two points in time.
What Does CAGR Not Tell You?
This is where many beginners misunderstand the metric.
CAGR does not tell you:
- how volatile an investment was;
- whether the investment experienced a major temporary loss;
- what happened in individual years;
- whether the return will continue;
- how much risk was taken;
- whether dividends or cash flows were involved in a way the calculation does not capture;
- whether one investment was safer than another.
A CAGR of 12% could come from relatively stable growth or from extremely volatile performance.
That is why CAGR should be viewed as one analytical measure rather than a complete investment assessment.
CFI similarly notes that CAGR provides an annualized growth measure while not describing the investment's price fluctuations or unpredictability.
CAGR vs Absolute Return
These two metrics answer different questions.
| Feature | CAGR | Absolute Return |
|---|---|---|
| Measures | Annualized compounded growth | Total percentage gain/loss |
| Considers time | Yes | No |
| Useful for multi-year comparison | Yes | Limited |
| Shows annualized figure | Yes | No |
| Shows actual yearly volatility | No | No |
Example
An investment increases from ₹1 lakh to ₹1.5 lakh.
Its absolute return is:
50%
But if that growth occurred over five years, the CAGR is much lower than 50%.
This demonstrates why saying “the investment returned 50%” without mentioning the time period can be misleading.
CAGR vs AAGR
CAGR and AAGR are not the same.
AAGR means Average Annual Growth Rate.
AAGR generally calculates the arithmetic average of annual growth rates.
CAGR instead uses compounded growth.
| Feature | CAGR | AAGR |
|---|---|---|
| Full form | Compound Annual Growth Rate | Average Annual Growth Rate |
| Calculation approach | Geometric | Arithmetic |
| Accounts for compounding | Yes | No |
| Useful for multi-period investment growth | Often useful | More limited |
| Can smooth start-to-end growth | Yes | No |
CFI describes AAGR as the arithmetic average of specified annual growth rates, while CAGR annualizes growth using compounding.
CAGR vs XIRR
This is particularly important for mutual-fund investors.
CAGR
CAGR works well when there is:
- one initial investment;
- one ending value;
- a clearly defined holding period.
XIRR
XIRR is generally more appropriate when there are multiple cash flows occurring on different dates.
For example:
- ₹10,000 invested in January
- ₹10,000 invested in April
- ₹15,000 invested in September
- additional investment later
- final redemption value
A simple CAGR calculation may not properly represent the investor's return because the amounts were invested at different times.
For irregular cash flows, an annualized cash-flow-based measure such as XIRR is generally more appropriate.
CAGR vs Simple Annual Return
A simple annual return describes performance over a particular one-year period.
CAGR describes annualized compounded growth over multiple periods.
Investor.gov defines annual return as the profit or loss on an investment over a one-year period and distinguishes it from broader annualized growth concepts.
Example
If an investment moves from ₹1,00,000 to ₹1,10,000 in one year:
Annual return = 10%
For a multi-year investment, CAGR gives the equivalent annual compounded growth rate between the starting and ending values.
How to Calculate CAGR in Excel
CAGR can be calculated easily in Microsoft Excel or Google Sheets.
Suppose:
- Beginning value is in cell A2
- Ending value is in cell B2
- Number of years is in cell C2
Use:
=(B2/A2)^(1/C2)-1
Then format the cell as a percentage.
Excel Example
| Cell | Value |
|---|---|
| A2 | ₹100,000 |
| B2 | ₹200,000 |
| C2 | 5 |
Formula:
=(B2/A2)^(1/C2)-1
Result:
14.87% approximately
CAGR Calculator: What Information Do You Need?
A basic CAGR calculator requires only three inputs:
- Beginning value
- Ending value
- Number of years
CAGR Calculator Formula
CAGR = [(Ending Value / Beginning Value)^(1 / Years)] − 1
This makes CAGR particularly easy to calculate when you have a single starting value and a single ending value.
How CAGR Works With Compounding
Compounding is the central idea behind CAGR.
Suppose ₹1,00,000 grows at a hypothetical 10% annual compounded rate:
| Year | Approximate Value |
|---|---|
| Start | ₹1,00,000 |
| Year 1 | ₹1,10,000 |
| Year 2 | ₹1,21,000 |
| Year 3 | ₹1,33,100 |
| Year 4 | ₹1,46,410 |
| Year 5 | ₹1,61,051 |
The second year's growth is calculated on ₹1,10,000 rather than the original ₹1,00,000.
That is the effect of compounding.
Investor.gov explains compound interest as interest earned on both principal and accumulated interest.
CAGR in Mutual Funds
CAGR is frequently used when discussing long-term mutual-fund performance, particularly when evaluating lump-sum investments.
For example, an investor may compare the historical CAGR of two equity funds over a five-year period.
However, investors should avoid looking at CAGR in isolation.
A proper mutual-fund review may also consider:
- benchmark performance
- category performance
- volatility
- portfolio concentration
- expense ratio
- investment strategy
- fund manager changes
- risk measures
- consistency
- taxation
- investment horizon
AMFI notes that equity-oriented growth funds can be volatile over shorter periods and generally require a medium- to long-term investment horizon.
Important Point for SIP Investors
For regular investments made at different dates, CAGR may not be the right return measure for the investor's actual cash flows.
XIRR can be more appropriate when there are multiple dated investments and withdrawals.
CAGR in Stocks
Investors can use CAGR to analyze the historical growth of:
- stock prices
- revenue
- earnings
- dividends
- market capitalization
But stock-price CAGR does not automatically equal an investor's total return.
For example, dividends, corporate actions, taxes and transaction costs can affect the actual investor experience.
Therefore, when comparing stocks, it is important to understand exactly what the CAGR is measuring.
CAGR in Business and Financial Analysis
Businesses frequently use CAGR to describe growth over multiple years.
Common applications include:
- Revenue CAGR
- Profit CAGR
- EPS CAGR
- Customer CAGR
- Sales CAGR
- Market-size CAGR
- AUM CAGR
For example, if a company's revenue rises from ₹100 crore to ₹200 crore over five years, analysts can calculate the revenue CAGR to describe the annualized growth rate.
This makes it easier to compare businesses with different starting and ending values.
Real-World India Example: Mutual Fund Industry Growth
CAGR is also useful for understanding financial-industry trends.
The AMFI-Crisil 2025 Factbook reported that India's mutual-fund industry assets under management rose from ₹22.26 lakh crore in March 2020 to ₹65.74 lakh crore in March 2025, representing a 24.2% CAGR over that period.
This is a good illustration of how CAGR can summarize substantial multi-year growth in a single figure.
It should not, however, be interpreted as saying that industry AUM increased by exactly 24.2% in each individual year.
What Is a Good CAGR?
There is no universal “good CAGR.”
A CAGR should be evaluated in context.
Consider:
- investment category
- risk level
- time period
- benchmark
- inflation
- fees
- taxes
- market conditions
- volatility
For example, comparing the CAGR of an equity fund with that of a low-risk fixed-income product without considering risk and objectives may produce an incomplete conclusion.
A higher historical CAGR does not automatically mean a better investment.
How to Evaluate CAGR Properly
A practical framework is to ask five questions.
1. What Is the Time Period?
A one-year CAGR-like figure can be far less informative than a long-term track record.
2. What Is Being Measured?
Is it:
- price?
- total return?
- revenue?
- profit?
- AUM?
- portfolio value?
3. What Was the Risk?
Two investments can have identical CAGRs but dramatically different levels of volatility.
4. What Is the Benchmark?
Compare like with like.
5. Are the Returns Historical?
Historical CAGR describes what happened over a particular period. It does not guarantee what will happen next.
Investor.gov emphasizes that investing involves risk and that market fluctuations can cause investments to lose value.
Pros and Cons of CAGR
Advantages of CAGR
- Easy to understand.
- Converts multi-year growth into an annualized figure.
- Useful for comparing historical growth.
- Incorporates compounding.
- Works well for single-start and single-end value comparisons.
- Useful in investment and business analysis.
- Easy to calculate using Excel or a calculator.
Limitations of CAGR
- Hides year-to-year volatility.
- Does not show interim losses.
- Does not measure investment risk.
- Does not guarantee future returns.
- Can be inappropriate for irregular cash flows.
- May not capture dividends or distributions unless the values used are appropriately adjusted.
- Can make highly volatile growth appear deceptively smooth.
Step-by-Step Guide: How to Use CAGR for Investment Analysis
Step 1: Identify the Starting Value
Find the investment value at the beginning of the selected period.
Step 2: Identify the Ending Value
Find the value at the end of the period.
Step 3: Determine the Number of Years
Use the correct investment period.
For example:
January 2021 to January 2026 = approximately five years.
Step 4: Apply the CAGR Formula
Use:
CAGR = (Ending Value / Beginning Value)^(1 / Years) − 1
Step 5: Convert the Result to a Percentage
Multiply the decimal result by 100.
Step 6: Put the Number in Context
Compare it with:
- appropriate benchmarks
- comparable investments
- inflation
- risk
- fees
- your financial goal
Common CAGR Mistakes to Avoid
Mistake 1: Confusing CAGR With Total Return
A 50% total return over five years is not a 50% annual return.
Mistake 2: Ignoring the Time Period
Always state the period alongside CAGR.
Mistake 3: Treating CAGR as a Guaranteed Return
Historical CAGR does not guarantee future performance.
Mistake 4: Using CAGR for Irregular Cash Flows
Multiple investments and withdrawals may require a cash-flow-based measure such as XIRR.
Mistake 5: Comparing Different Risk Categories
A higher CAGR may come with substantially higher volatility or risk.
Mistake 6: Ignoring Costs
Taxes, fees and other costs can reduce actual investor returns.
CAGR and Inflation
A nominal CAGR does not automatically represent an investor's increase in purchasing power.
Suppose an investment grows at 10% CAGR while inflation averages 6%.
The investor's real purchasing-power growth would be lower than the nominal 10%.
For long-term financial planning, investors should therefore distinguish between:
- nominal returns
- inflation
- taxes
- investment costs
- real returns
This becomes particularly important for retirement and other long-term goals.
CAGR and the Power of Time
Compounding becomes increasingly significant as the investment period increases.
For example, hypothetical growth of ₹1,00,000 at a constant 10% annual compounded rate would produce approximately:
| Period | Hypothetical Value |
|---|---|
| 5 years | ₹1.61 lakh |
| 10 years | ₹2.59 lakh |
| 15 years | ₹4.18 lakh |
| 20 years | ₹6.73 lakh |
| 25 years | ₹10.83 lakh |
These are mathematical illustrations, not forecasts or promises of investment returns.
The underlying principle is that returns can themselves contribute to future growth.
Investor.gov similarly highlights the importance of time and compound growth in long-term investing.
Expert Commentary: Why CAGR Should Not Be Used Alone
CAGR is powerful because it simplifies a complicated multi-year growth path.
But simplicity can also hide information.
Imagine two investments both showing a 15% CAGR over five years.
Investment A may have experienced relatively moderate fluctuations.
Investment B may have fallen 40% at one point and subsequently recovered.
The CAGR could look identical even though the investor experience was completely different.
Therefore, a professional investment review should combine CAGR with measures such as:
- volatility
- maximum drawdown
- benchmark comparison
- risk-adjusted returns
- liquidity
- investment objective
- time horizon
CAGR tells you how fast something grew between two points. It does not tell you the entire journey.
Real-World Experience Point: Why the Journey Matters
Investors often focus on the final number.
For example:
“This investment delivered a 15% CAGR.”
But an investor considering that investment should also ask:
“What happened between the starting date and ending date?”
The answer may reveal:
- major market corrections
- temporary losses
- periods of stagnation
- rapid rallies
- changes in strategy
- significant volatility
This is especially important for investors who may need their money before the end of a long investment horizon.
CAGR Summary Table
| Question | Answer |
|---|---|
| What is CAGR? | Compound Annual Growth Rate |
| What does it measure? | Annualized compounded growth |
| Main inputs | Beginning value, ending value, time |
| Formula | (Ending ÷ Beginning)^(1/Years) − 1 |
| Shows yearly volatility? | No |
| Guarantees future returns? | No |
| Useful for lump-sum investments? | Yes |
| Useful for business growth? | Yes |
| Best for irregular cash flows? | Usually no; consider XIRR |
| Can be used for mutual funds? | Yes, depending on cash-flow structure |
| Is higher CAGR always better? | No |
CAGR Formula Cheat Sheet
Basic Formula
CAGR = (EV / BV)^(1/n) − 1
Where:
- EV = Ending Value
- BV = Beginning Value
- n = Number of years
To Calculate Ending Value
Ending Value = Beginning Value × (1 + CAGR)^n
To Calculate Beginning Value
Beginning Value = Ending Value ÷ (1 + CAGR)^n
These formulas are useful for financial analysis, business planning and investment illustrations.
Key Takeaways
- CAGR stands for Compound Annual Growth Rate.
- It converts multi-year growth into an annualized compounded rate.
- The standard formula uses beginning value, ending value and number of years.
- CAGR is useful for comparing historical growth across investments or businesses.
- CAGR does not show year-by-year volatility.
- CAGR does not guarantee future investment returns.
- Absolute return and CAGR are different measures.
- CAGR and AAGR use different approaches to annualizing growth.
- XIRR can be more suitable when investments or withdrawals occur on multiple dates.
- Mutual-fund investors should understand the difference between lump-sum CAGR and returns from recurring investments.
- A higher CAGR does not automatically mean a better investment.
- Risk, volatility, fees, taxes, liquidity and investment objectives should also be considered.
- Compounding makes time an important factor in long-term wealth creation.
Frequently Asked Questions About CAGR
1. What is CAGR in simple words?
CAGR is the annualized compounded growth rate that connects an investment's starting value to its ending value over a specified period.
2. What is the full form of CAGR?
CAGR stands for Compound Annual Growth Rate.
3. What is the CAGR formula?
The formula is:
CAGR = (Ending Value / Beginning Value)^(1 / Number of Years) − 1
4. How is CAGR calculated?
To calculate CAGR, divide the ending value by the beginning value, raise the result to the power of one divided by the number of years, and subtract one.
5. What does a 10% CAGR mean?
A 10% CAGR means the starting value would have grown at an equivalent compounded annual rate of 10% to reach the ending value over the specified period. It does not mean the actual return was exactly 10% every year.
6. Is CAGR the same as annual return?
No. CAGR is an annualized compounded growth measure over a multi-year period, while annual return generally refers to performance over a particular year.
7. Is CAGR the same as absolute return?
No. Absolute return measures the total gain or loss over the investment period, while CAGR expresses that growth as an annualized compounded rate.
8. Is CAGR better than AAGR?
They serve different purposes. CAGR uses compounded growth between beginning and ending values, while AAGR is generally an arithmetic average of annual growth rates.
9. Can CAGR be negative?
Yes. If the ending value is lower than the beginning value, the calculated CAGR will be negative.
10. Is CAGR useful for mutual funds?
Yes, CAGR can be useful for evaluating historical growth of a lump-sum mutual-fund investment. For investments made through multiple contributions, a cash-flow-based measure such as XIRR may be more appropriate.
11. Is CAGR useful for SIP investments?
CAGR can be useful for understanding certain fund-level growth figures, but it may not accurately represent the investor's personal return when contributions occur on different dates. XIRR is commonly used for irregular cash flows.
12. What is a good CAGR for an investment?
There is no universal good CAGR. The appropriate benchmark depends on the asset class, risk, time period, investment objective, fees, taxes and market conditions.
13. Does CAGR guarantee future returns?
No. CAGR is a historical or hypothetical annualized growth measure. It does not guarantee future investment performance.
14. Can CAGR be calculated in Excel?
Yes. If the beginning value is in A2, ending value in B2 and number of years in C2, the formula can be written as:
=(B2/A2)^(1/C2)-1
15. Why is CAGR important?
CAGR makes multi-year growth easier to understand and compare by converting beginning-to-ending growth into an annualized compounded percentage.
Vizzve Financial: Support for Your Financial Needs
Vizzve Financial is one of India’s trusted loan support platforms offering quick personal loans, low documentation, and an easy approval process. Apply at www.vizzve.com.
Before taking a loan, borrowers should review the applicable interest rate, processing fees, repayment schedule, eligibility criteria and total borrowing cost.
A loan is a financial commitment, so repayment capacity should be considered before applying.
Conclusion
CAGR is one of the most useful concepts for understanding long-term growth.
Whether you are analyzing a mutual fund, stock, business revenue, market size or portfolio value, CAGR converts the change between a beginning value and an ending value into a single annualized compounded percentage.
Its biggest advantage is simplicity.
Its biggest limitation is also simplicity.
Because CAGR smooths the investment journey, it does not reveal volatility, interim losses or the path taken to reach the final value.
That is why CAGR should be used alongside other information rather than treated as a complete measure of investment quality.
For investors, the best approach is to consider CAGR together with risk, time horizon, diversification, costs, taxes, liquidity and financial objectives.
For borrowing and personal-loan support, Vizzve Financial provides a convenient digital application experience. Visit www.vizzve.com to learn more.
Published on : 24th september
Published by : Sumanth Arumulla
www.vizzve.com || www.vizzveservices.com
Follow us on social media: Facebook || Linkedin || Instagram
🛡 Powered by Vizzve Financial
RBI-Registered Loan Partner | 10 Lakh+ Customers | ₹600 Cr+ Disbursed